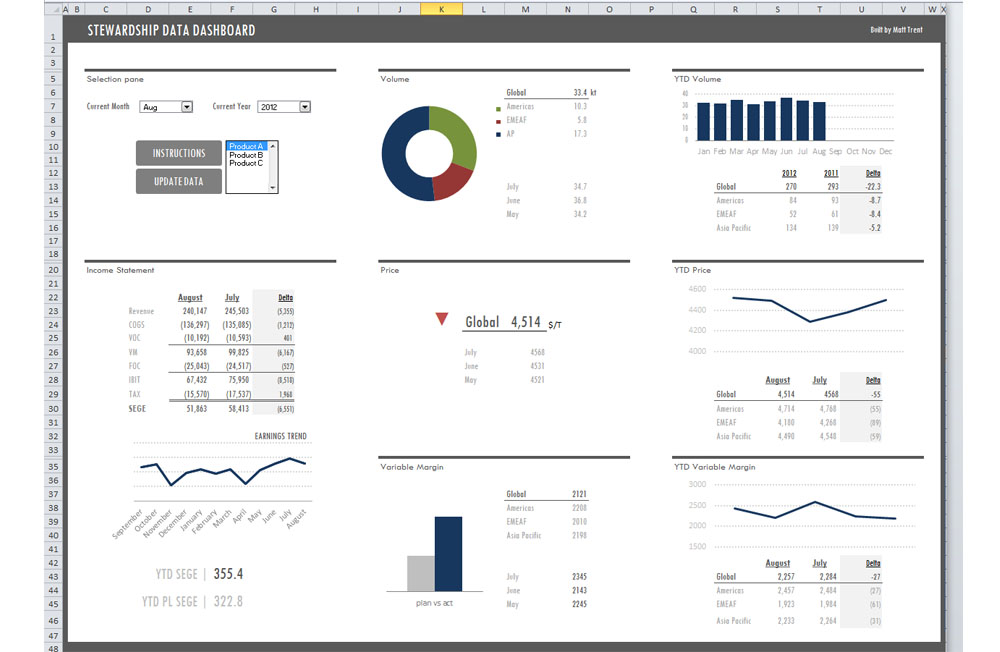
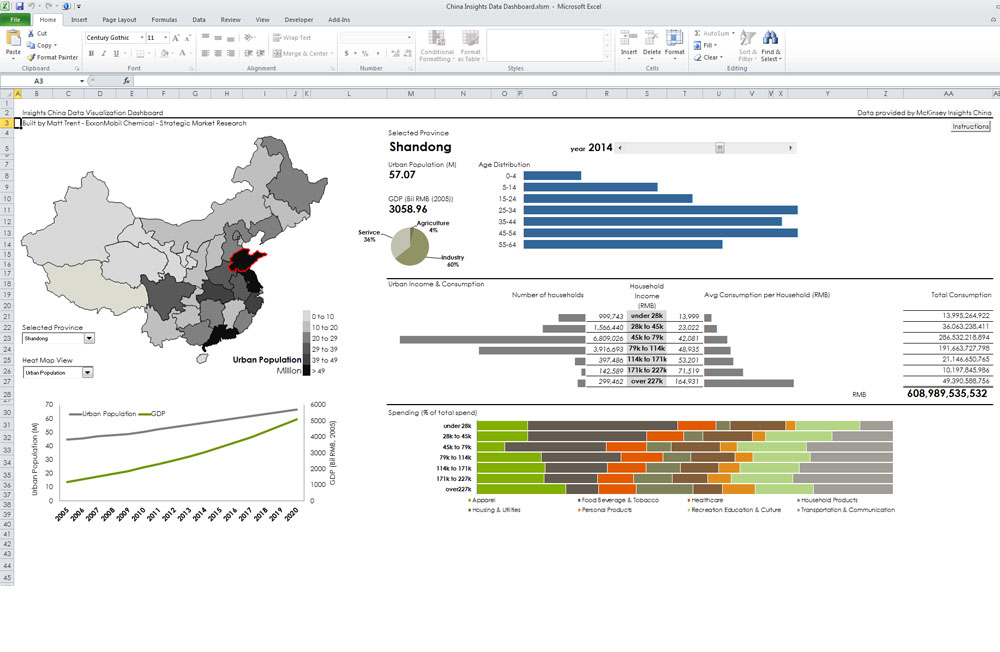
Data is powerful. It answers questions and allows us to make good decisions. Without visualization tools though, data can be confusing. Just a bunch of numbers that are hard to interpret. While working as an analyst in marketing and finance I created interactive data visualization tools that allowed users to explore what they were interested in and find answers to their questions. Along the way I became quite familiar with Excel and other data visualization tools. These examples are dashboards built in Excel using standard formula functionality and some minor Visual Basic for Applications (VBA) coding.

